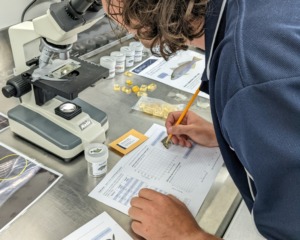
In this activity, students will learn the role ageing fish plays in the sustainable management of fish populations. Students will learn how and why fisheries scientists age fish, then try their hand at ageing prepared microscope slides of sectioned fish otoliths.

Duration: 1 hour
The role of the Department of Primary Industries and Regional Development is to conserve, develop sustainably and manage the shared use of the State’s aquatic resources and ecosystems for the benefit of present and future generations. To do this, the Department must continuously assess the health of fish populations and adjust management practices to ensure fish for the future.
The Department’s fisheries scientists use fish ageing as a valuable tool to learn about the biology and assess the population structure of a species. The population structure of a species, or how many individuals exist at each age, tells scientists a lot about the health of a fishery. From this activity, students learn how otoliths are used to age fish and the importance of this information to maintaining sustainable fisheries.
Cost: $5.00 per student
Activity Outline:
In the Fish of Ages activity, students will be given a brief presentation which explains the process of fish ageing and its importance to sustainable fisheries management. They will then age fish using prepared slides of sectioned otoliths, use graphs to represent their data, and draw conclusions about the health of a fish population. Through the completion of these activities, students will be able to:
- Describe how otoliths are collected, prepared, and read to age fish.
- Explain why the rings observed in the fish’s otoliths can be used to accurately age fish.
- Describe how fish age is combined with length and reproductive information to understand the biology of a fish species and inform management decisions.
- Describe what a healthy fish population looks like in terms of its population structure and explain how fishing impact alters the fish’s population structure.
- Use sample data from a particular fish species to create a growth structure scatterplot and an age structure column graph.
- Assess whether a fish population is being overfished based on the graphs they have created.
You may also wish to combine this activity with the Fish Dissection activity for a 1.5-hour session that is $8 per student.
Pre-excursion and post-excursion resources:
You can find information on the Department’s fish aging research in Fact Sheet: Fish ageing. You can also use the related resources below to lead a similar activity to our excursion in your classroom using images of whole Australian herring and sectioned Black bream otoliths.
